
Short answer
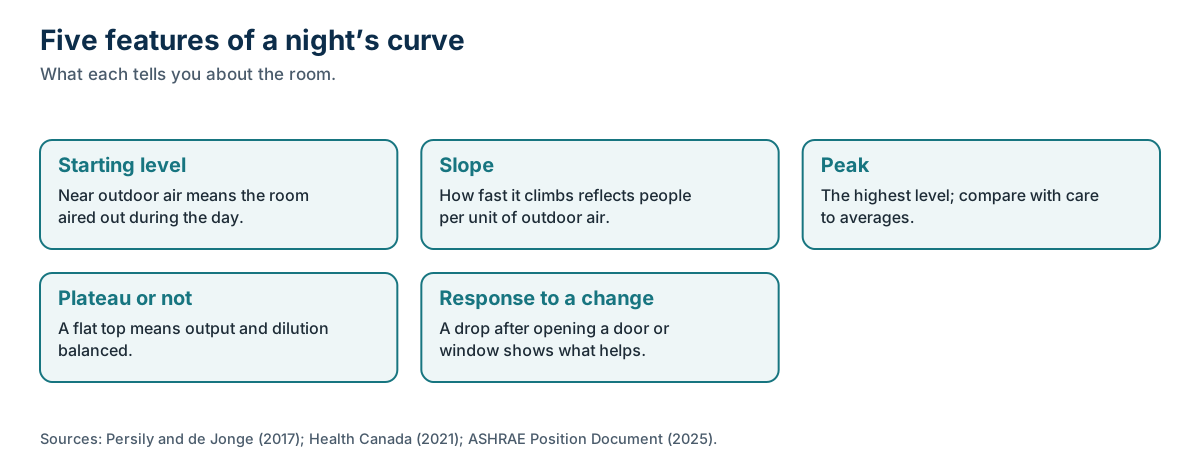
Read the shape, not just the peak. The starting level shows how well the room aired out by day. The slope after lights out reflects how many people are breathing per unit of outdoor air. A flat plateau means intake and dilution balanced; a curve still rising at dawn means little air exchange. A sharp drop when a door or window opens shows what helps. Compare nights, changing one thing at a time.
Key terms used on this page
- Steady-state CO2:
- The level where CO2 stops rising because outdoor air removes it as fast as people add it. Persily and de Jonge's model puts two sleeping adults in a 65 m3 bedroom at 1,988 ppm above outdoors at 0.2 air changes per hour.
- Ventilation time constant:
- The inverse of the air change rate. Persily and de Jonge note that three time constants are needed to reach about 95% of steady state, so a room at 0.2 air changes per hour may never get there in one night.
- Outdoor CO2 baseline:
- The CO2 level of outdoor air, the floor an indoor reading falls back toward when a room is well aired. NOAA's Mauna Loa record averaged 427.55 ppm in August 2026; ASHRAE notes it passed 400 ppmv in 2013.
- Long-term exposure limit (Health Canada):
- Health Canada's residential guideline for CO2: 1,000 ppm based on a 24-hour average. Health Canada says sampling for comparison should last at least 24 hours under normal conditions.
- NDIR sensor:
- A non-dispersive infrared sensor, which measures CO2 by how much infrared light it absorbs. One maker's datasheet for an NDIR module lists accuracy of plus or minus 30 ppm plus 3% of the reading.
A night of bedroom CO2 data has a shape, and the shape tells you more than the highest number. The starting level shows how well the room aired out during the day. The climb after lights out reflects how many people are breathing for the outdoor air available. Whether the curve flattens tells you whether air exchange caught up. And a drop when a door or window opens shows what actually works. Here's how to read each part, using an illustrative example.
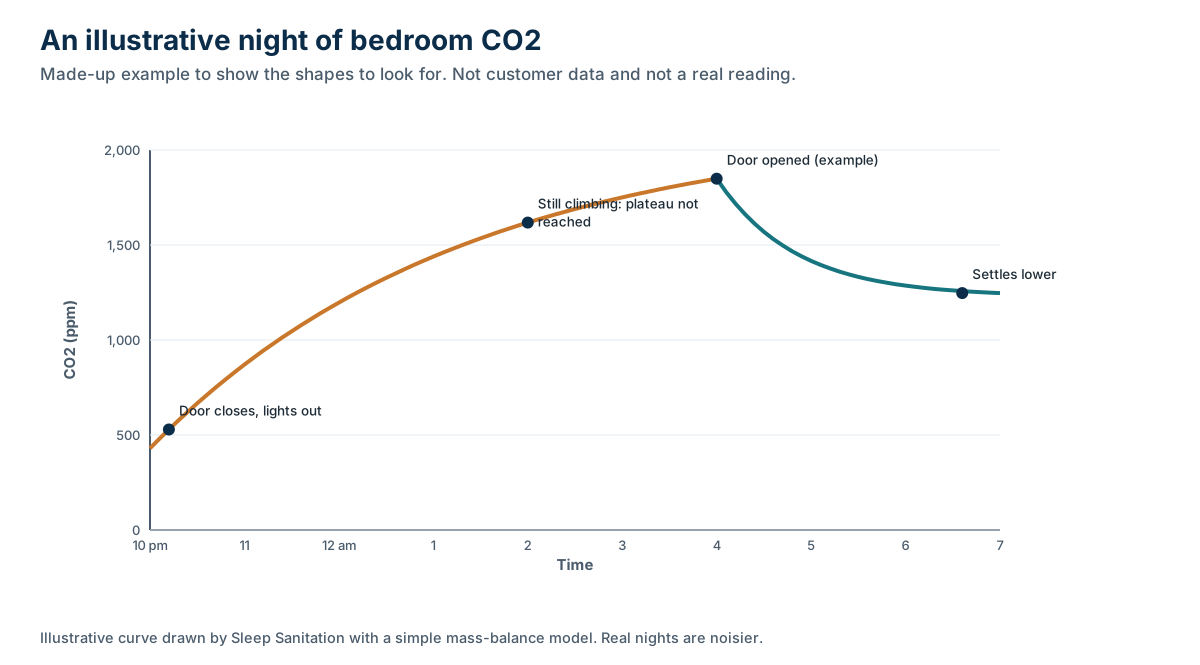
General information about bedroom air and ventilation, not medical advice. The chart above is illustrative: a modeled curve, not customer data or a real reading.
Where does the night start?
Look at the level when you go to bed. If it's near outdoor air, around 430 ppm according to NOAA's Mauna Loa record, the room aired out during the day. If it's already 700 or 800 ppm, the house as a whole may be getting limited outdoor air, or people were in the room all evening with the door closed.
A high starting point raises everything that follows. Two bedrooms with identical ventilation can end the night at different peaks simply because one started higher.
What does the climb tell you?
How fast CO2 is being added relative to the air carrying it away. Right after lights out, the curve rises fastest; then it bends as outdoor air removes more CO2 at higher concentrations. A steep early climb means many people for the room's airflow, or a small room. A gentle climb means fewer people, a larger room or more outdoor air.
Why CO2 builds up in a closed bedroom overnight explains the math. In model values from Persily and de Jonge, two sleeping adults in a 65 m3 room settle 795 ppm above outdoors at 0.5 air changes per hour and 1,988 ppm above outdoors at 0.2.
Does it level off?
This is the most informative feature. A curve that flattens by the middle of the night means the room reached its steady state: CO2 out matched CO2 in. The plateau height reflects airflow per sleeper. A curve that's still rising at dawn means the room's air exchange is slow. Persily and de Jonge note that reaching about 95% of steady state takes "three time constants," and the time constant is the inverse of the air change rate. At 0.2 air changes per hour, that's about 15 hours.
So a 6 a.m. peak in a tight room isn't a ceiling; it's where the curve happened to be when you woke up. A longer night would have read higher.
What happens when something changes?
The curve responds, and that's the most practical information in the whole log. In the illustrative chart, the door opens around 4 a.m. and the level falls toward the house's mix. Common causes of a mid-night change:
- Someone opens the bedroom door. The room joins the rest of the house.
- The HVAC fan or a ventilation system turns on. A timed system can produce regular dips.
- Wind picks up. More leakage, more outdoor air.
- Someone leaves the room. Less CO2 being added.
In real homes, these changes can be large. In the Danish study by Fan et al. (2022), opening doors cut the mean 95th-percentile CO2 during sleep from 2,916 to 1,415 ppm, and opening windows cut it from 2,310 to 904 ppm. A DOE Building America guide describes closed-door bedrooms getting about half the outdoor air of central spaces until a mixing fan ran.
What about the morning?
After everyone gets up and the door opens, the level should decay toward the house or outdoor level. How fast it falls reflects the air exchange of the space it's connected to. A slow morning decay in a room left closed means slow air exchange; it's the same information as the overnight climb, seen in reverse. ASHRAE's position document explains that indoor-outdoor differences "can be used to evaluate outdoor ventilation rates," though accurate estimates need several assumptions.
How should you compare with guidelines?
Carefully. Health Canada's residential guideline is 1,000 ppm "based on a 24-hour average," and it says sampling should last "at least 24 hours, taken under normal conditions." A night that peaks at 1,600 ppm may still average under 1,000 across a day. The ASHRAE committee brief offers tentative sleep relationships, below 750 ppm, around 1,150 ppm and above 2,600 ppm, but frames them as ventilation rates allowing CO2 to reach those levels, not limits. What is a normal bedroom CO2 level? lays out what each number means.
What patterns suggest a monitor problem?
- Readings below outdoor air, such as 350 ppm indoors. Calibration has drifted, or it's an eCO2 device.
- Sharp spikes every few minutes that track breathing or movement. The monitor is too close to someone's face.
- A flat line all night with people in the room. The monitor may not be logging, or it's next to an open window or supply vent.
- Big jumps when cooking or cleaning that don't match ventilation. That's typical of eCO2 sensors that respond to other gases.
How home CO2 monitors work explains how to check yours.
What about several nights in a row?
Compare them side by side. Nights with the same sleepers and similar weather should look alike; if one stands out, look for a reason, such as an open door, a guest, a windy night or a ventilation fan that ran longer. Patterns that repeat are the ones worth acting on. A single unusual night is better treated as a clue than a conclusion, which is why Health Canada recommends repeated samples for long-term estimates.
Turning a log into a change
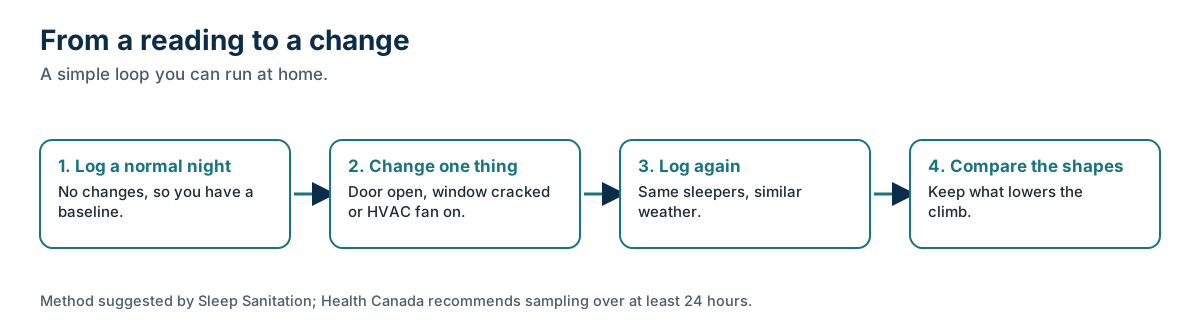
The best use of a log is a simple experiment. Record a normal night as your baseline. Change one thing: leave the door open, crack a window, or run the HVAC fan overnight. Record again with the same sleepers and similar weather. Keep the change that lowers the climb or produces a plateau, if it fits how you like to sleep. Health Canada notes that identifying sources and reduction measures is often more useful than comparing numbers to a limit, and that's what this does. Open door vs window vs fan lists the options, and the hub links the rest.
Sleep Sanitation's view
This section is our view. A good log answers practical questions, like whether the door matters or whether the ventilation system reaches the bedroom, without anyone needing to guess. Our optional 72-hour bedroom CO2 test logs three nights and gives a plain-language ventilation report with airflow tips. It's priced by quote, booked on its own or added to a mattress visit, and it isn't a medical test. To book, see scheduling.
What we don't know
- How much a sleeper's breathing zone differs from the reading at nightstand height in real bedrooms. Models assume well-mixed air.
- How night-to-night variation in a typical home compares with the effect of a single change. We found no published bedroom data on this.
- Whether the shape of the curve, beyond its level, relates to sleep. The studies we found reported averages and percentiles.
Changelog
- 7 October 2026: First published. Sources accessed on this date.
Sources
- Carbon dioxide generation rates for building occupants (Persily and de Jonge, Indoor Air, 2017) · PubMed Central
- Residential Indoor Air Quality Guidelines: Carbon Dioxide (2021) · Health Canada
- ASHRAE Position Document on Indoor Carbon Dioxide (approved 2025) · ASHRAE
- Residential Issue Brief: Ventilation, IEQ and Sleep Quality in Bedrooms (2022) · ASHRAE Residential Buildings Committee
- A field intervention study of the effects of window and door opening on bedroom IAQ, sleep quality, and next-day cognitive performance (Fan et al., 2022) · Building and Environment (DOI)
- Measure Guideline: Selecting Ventilation Systems for Existing Homes (Building America, 2014) · US Department of Energy
- Trends in Atmospheric Carbon Dioxide (Mauna Loa monthly mean) · NOAA Global Monitoring Laboratory
Last reviewed October 7, 2026. Manufacturer specifications and care instructions change; check the current version for your exact model. This page is general information, not medical advice. How we source and check pages: editorial standards.